This post illustrates and interprets different tables, graphs, and statistics of the Population of Pakistan. It also explains the formula used in the calculation of birth, death, and birth rates, and related concepts.
Contents
How is the crude birth rate calculated?
The crude birth rate is calculated by dividing the number of births by1000 and multiplied by 100. It may simply be defined as the Number of births per 1000 people multiplied by 100.
The formula can be put as follows:
No. of births/1000 x 100= Crude birth rate
How is the crude death rate calculated?
The crude death rate is calculated by dividing the number of deaths by 1000 and multiplied by 100. It can be simply be defined as the Number of births per 1000 people multiplied by 100.
The formula can be put as follows:
No. of death/1000 x 100= Crude birth rate
Death and birth rate of Pakistan over the years
|
Survey Period |
Birth rate per 1000 | The crude death rate per 1000 |
|
1984 – 1988 |
42.7 | 10.9 |
|
1989 – 1994 |
39.5 |
10.1 |
|
1996 |
35.5 |
8.7 |
|
1998 |
32.7 |
9.1 |
|
2004 |
28.0 |
8.10 |
|
2009 |
25 |
7.7 |
Economic Survey of Pakistan 2008-2009 |
||
Interpretation of the table
The statistics of the population of Pakistan given in the above table illustrate that has been a consistent decrease in the crude birth rate in Pakistan. According to the table, the crude death rate also decreased from 1984 till 1996 but it was increased in 1998. It has consistently decreased since 1998 till date. Thus, it can be concluded that birth and death rates in Pakistan have decreased consistently over the years.
Percentage of population growth from 1951-2008
| Year | Annual growth rate |
| 1951 | 1.7 |
| 1961 | 2.4 |
| 1971 | 3.69 |
| 1981 | 3.06 |
| 1983 | 2.99 |
| 1987 | 2.82 |
| 1988 | 2.77 |
| 1989 | 2.73 |
| 1993 | 2.56 |
| 1994-95 | 2.51 |
| 1995-96 | 2.43 |
| 1996-97 | 2.38 |
| 1998 | 2.34 |
| 1999 | 2.29 |
| 2000 | 2.24 |
| 2001 | 2.22 |
| 2002 | 2.16 |
| 2003 | 1.94 |
| 2004 | 1.90 |
| 2008 | 1.80 |
| Economic Survey of Pakistan 2007 – 08 | |
Interpretation of the table
The growth rate of Pakistan increased consistently in the first two decades from 1951 to 1971. After 1983 there has been a consistent decrease in the natural increase rate of the population of Pakistan as illustrated in the demographic transition model of Pakistan.
Demographic Transition Model of Pakistan
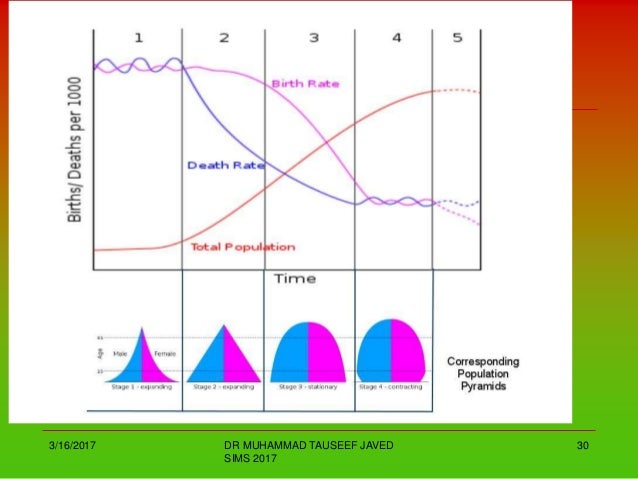
Pic Courtesy: Dr. Muhammad Tauseef Javed SIMS 2017